Conversion Rate Improvement That Actually Moves the Needle
A hands-on guide to conversion rate improvement using proven CRO methods. Audit, test, and optimize for measurable lift without guesswork.
Your traffic report is up, the campaign is sending visitors, and the dashboard looks healthy. But trial starts or sales haven't moved, and the team is debating whether the headline, button color, or offer is to blame.
That's a familiar CRO trap. Conversion rate improvement isn't a copywriting exercise; it's a measurement discipline. The useful question isn't whether a page feels more persuasive. It's whether a clearly defined audience completes a valuable action, and whether the change improves downstream results without harming trust or revenue.
Why Your Conversion Rate Feels Stuck
A weekly review shows steady sessions, active ads, and a recently redesigned landing page. Activations haven't budged. The team debates the headline and button placement, but those ideas don't reveal where visitors leave or what stopped them.
Stalled conversion work often starts with treating conversion as a landing-page problem instead of a full-funnel system. Visitors can understand an offer, then abandon a trial form, struggle to get a result, or decide not to pay. Measuring only the first click turns activity into a false sign of progress, especially when AI-assisted traffic brings visitors who may click without showing meaningful intent.
Another common failure is substituting opinions for experiments. A redesign may look clearer to internal reviewers while adding friction for users. Without a baseline, a defined outcome, and a credible comparison, the team cannot tell whether the change helped.
A click marks a step, not a result. It doesn't show that a visitor received value or that the business earned revenue. Track the downstream action that matters, and account for transparency disclosures that may influence whether visitors continue. More clicks can still mean less revenue if the change attracts low-intent traffic or obscures what users are agreeing to.
Benchmarks provide context, not a target for every business. For context, worldwide ecommerce conversion was 1.3% in Q2 2025, while Switzerland reached 2.4%. Those headline figures illustrate why geography matters; category differences matter too. The audit section's table provides the fuller breakdown, so use it to compare like with like rather than treating a broad average as a page-level goal. YipSMS Inc.’s guide for eCommerce merchants offers a useful overview of the process and terminology.
Start by defining what counts as a conversion, then trace friction through the full journey and test changes against that outcome. A copy change earns its place only when it improves a meaningful result, not merely the click rate.
Running a Conversion Audit You Can Trust
A trustworthy audit starts before anyone changes a page. Its job is to identify where users hesitate, what those users were trying to do, and whether the apparent problem is consistent across audiences.
Define the event and map the path
Choose one primary conversion event for the audit, such as completing a free trial, generating a detector result, or purchasing a plan. Then map the steps that lead to it. A tool that counts only paid upgrades may miss whether visitors leave before starting a trial or fail to reach a useful result.
For every step, ask: Where does the largest drop-off occur? What action should happen next? Does the event represent real value, or merely a click? A conversion rate optimization audit guide from Up North Media can provide another perspective on organizing this diagnostic work.
Instrument the journey, then find the clues
Track funnel events consistently and use stable user identifiers where appropriate. Segment the results by device, language, traffic source, and cohort date so the overall average doesn't hide a problem limited to one group. Check whether visitors from a specific campaign behave differently from returning users, and whether mobile users experience errors or delays that desktop users don't.
Quantitative tools show where users stop. Analytics funnels, form analytics, and heatmaps can surface drop-offs, missed controls, or repeated interactions. But they rarely explain the reason on their own. Review session replays and run short user tests to see whether people hesitate over unclear wording, look for missing information, or hit a technical obstacle.
Mobile speed deserves its own check. In a Google study, a 0.1-second improvement in loading time was associated with a 10.1% increase in conversions among travel users and an 8.4% increase among retail users; the retail group also recorded a 9.2% increase in average order value. Those results aren't a guarantee for every site, but they make a strong case for checking page performance as part of the audit, not treating it as a separate engineering concern. Google's mobile performance research provides the study details.
| Segment | Q2 2025 Rate | Why It Matters |
|---|---|---|
| Worldwide ecommerce | 1.3% | A broad reference point, not a target for every store |
| Switzerland ecommerce | 2.4% | Shows that geographic mix can change the benchmark |
| Selected ecommerce sectors | 1.4% average | Sector mix affects the blended rate |
| Skincare | 2.4% | A category-specific comparison |
| Food and beverage | 2.3% | Another category-specific comparison |
Source: Statista's ecommerce conversion-rate data.
Finish the audit by ranking observations, not collecting an endless list of complaints. Give each issue a simple score for reach (how many users encounter it), severity (how much it blocks the task), and confidence (how clearly evidence supports the diagnosis). Test the highest-ranked problem first.
Turning Observations into Testable Hypotheses
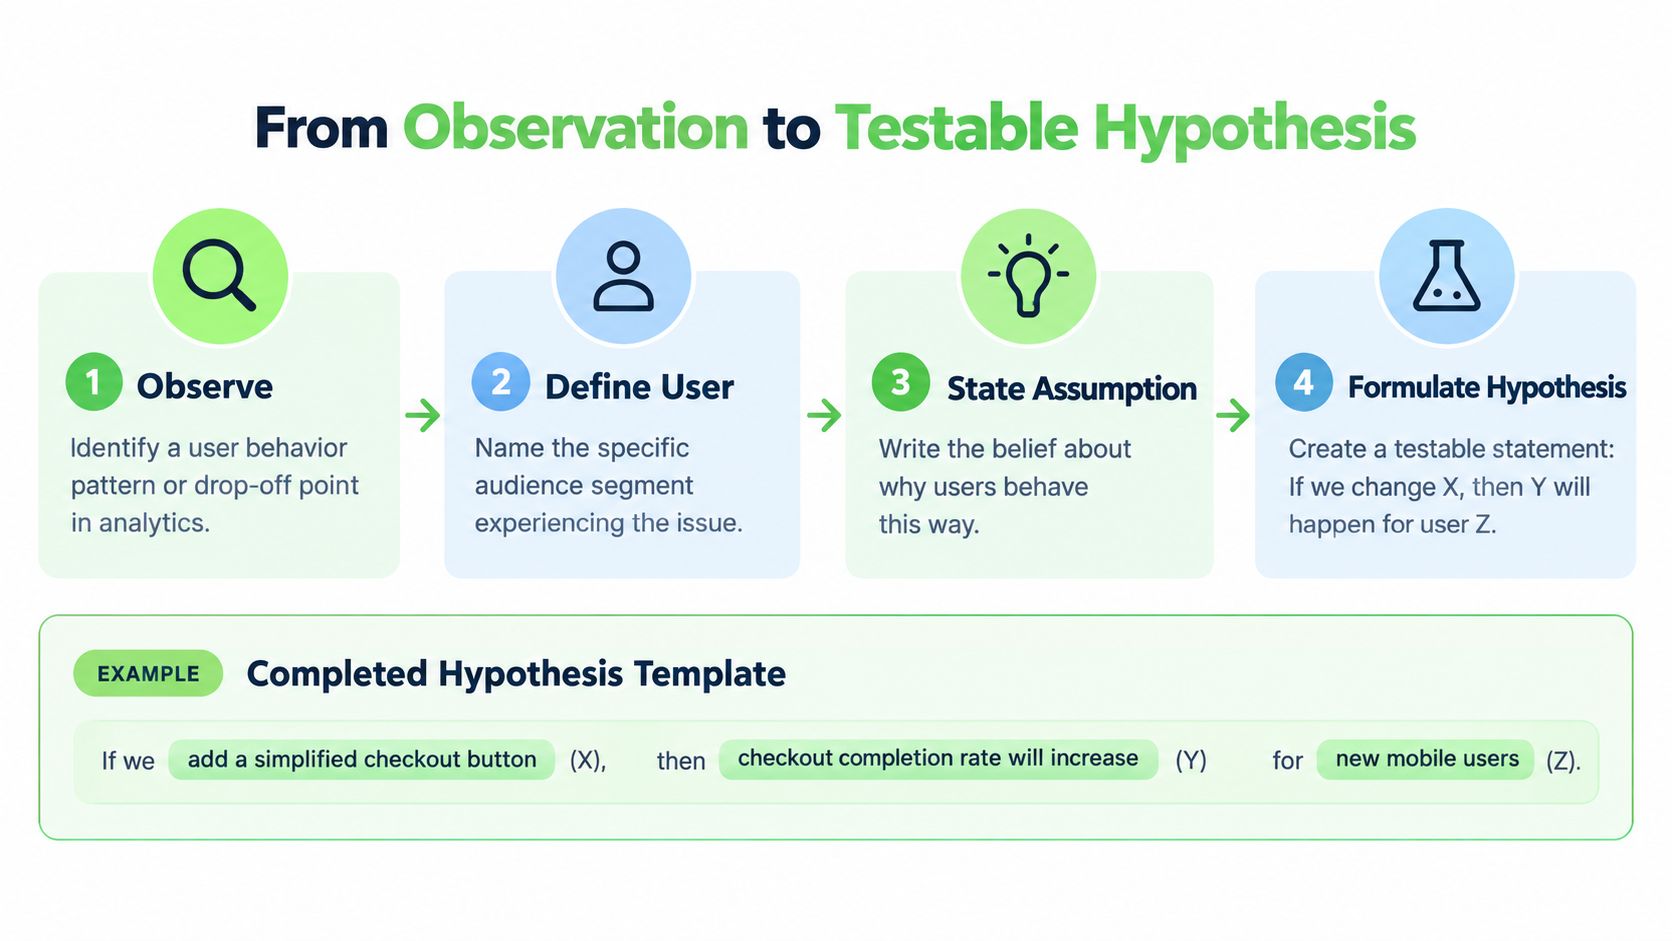
A visitor reaches a SaaS trial page, reads through it, then leaves without starting a trial. “Improve the hero” does not explain why that happened or how a change would address it. A useful hypothesis connects the user, the friction, the change, the expected effect, and the metric.
For first-time visitors arriving from a product-comparison search, for example, the team might suspect that uncertainty about the trial is stopping sign-ups. The hypothesis could be: Explaining what the trial includes before the form will reduce uncertainty and increase completed trial starts. Measure trial completion, and track paid conversion and form errors as guardrails. A rise in clicks or trial starts only matters if it supports the commercial goal without worsening downstream results.
The statement should be easy to challenge before anyone builds a variant. Do recordings or other research show uncertainty, or are visitors comparing options? Does the proposed change answer their question, or add copy? Making those assumptions explicit helps separate a testable explanation from a design preference.
Prioritize ideas by the evidence you have
ICE (impact, confidence, ease) offers a quick way to compare ideas in a backlog. PIE (potential, importance, ease) can help when choosing between pages or opportunities, since it accounts for the value of the area being considered. Neither framework makes the decision objective. Their practical benefit is requiring the team to explain why an idea merits attention.
Suppose trial recordings show visitors returning to the pricing explanation before starting a free trial. Bringing key pricing or trial terms closer to the form may help, but the pattern alone does not reveal why visitors return. They may be confused about the terms, or comparing options. A short user test can distinguish those explanations before the team commits to a larger experiment.
Keep the commercial context in view. A move from 1.3% to 1.6% is a 0.3-percentage-point gain, roughly a 23% relative increase, against the worldwide ecommerce baseline noted earlier. Percentage points and relative growth describe different things, so label the change accurately. Neither measure predicts what a specific test will deliver; choose the success metric based on the business outcome the experiment is meant to improve.
Record each candidate's evidence, audience, primary metric, guardrails, and implementation effort in the backlog. That record makes weak assumptions visible and helps prevent appealing but unsupported ideas from displacing problems users encounter.
Running A/B Tests That Actually Decide Anything
A test can produce a clean-looking dashboard and still leave the team with the wrong decision. The safeguards are set before launch, not added afterward to make a result look convincing.
Set the test up before traffic arrives
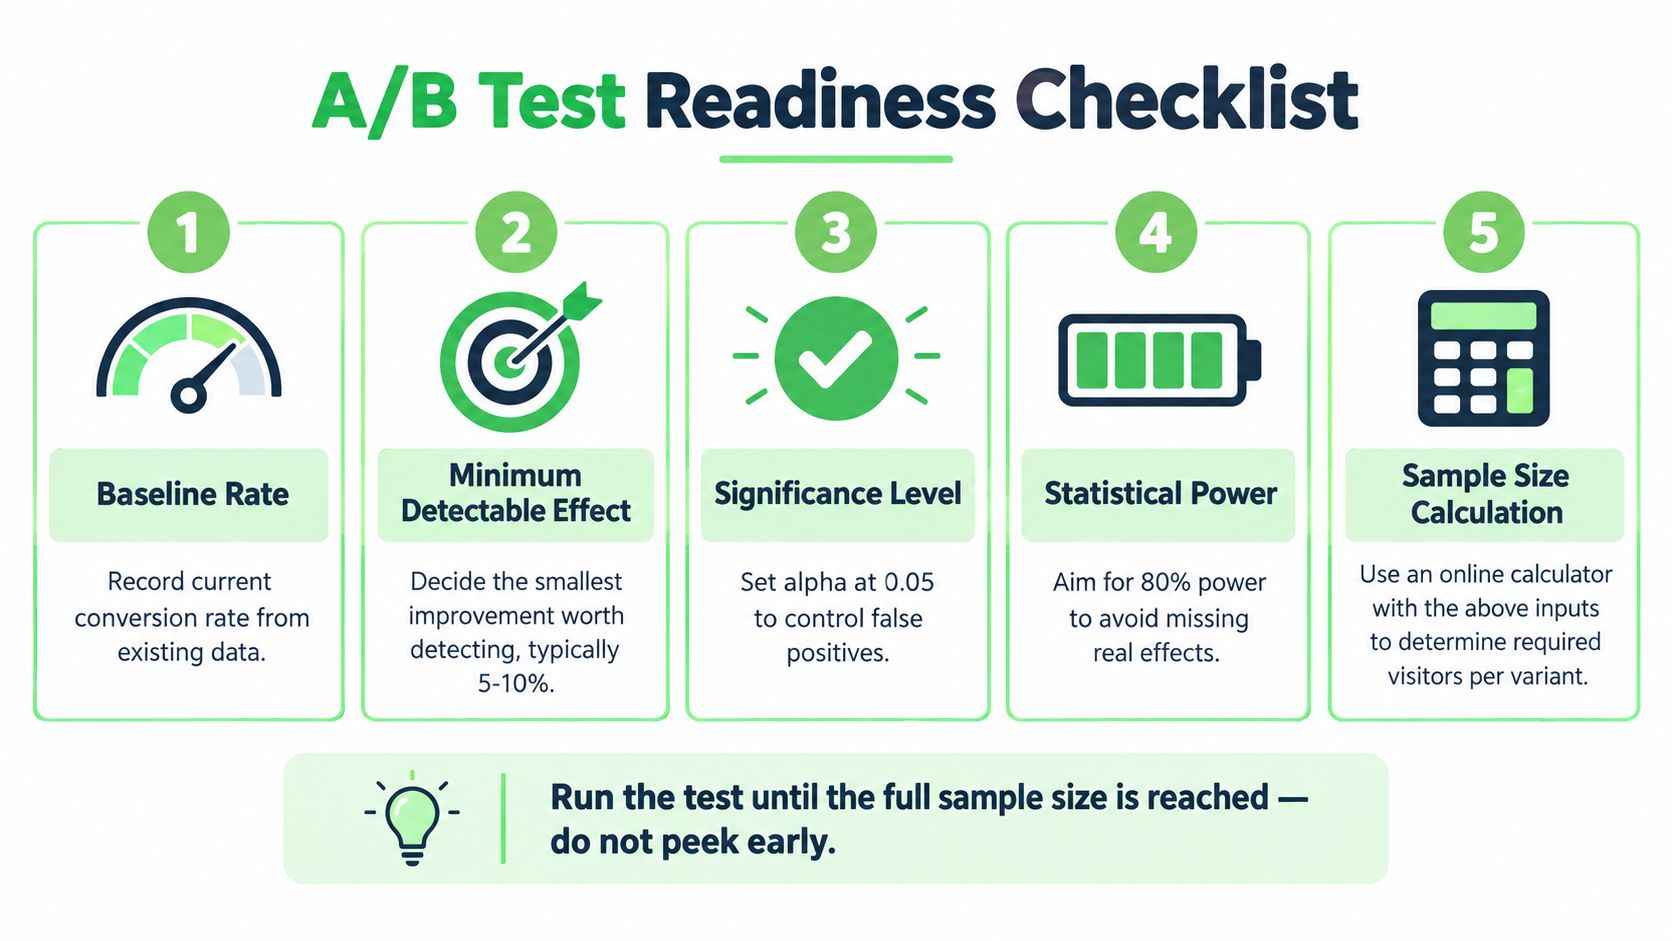
Start with the baseline conversion rate, the smallest effect worth detecting, your significance level, and your desired statistical power. Calculate the sample size before launch. If the page gets too little traffic to answer a small question, choose a larger, evidence-backed change or use qualitative research to improve the hypothesis rather than pretending the test will settle it.
For example, one published calculation estimates that a landing page converting at 3% would need roughly 85,000 visitors per variation to detect a 10% relative improvement with 80% power. The estimate illustrates why tiny copy tweaks can be a poor fit for a low-traffic page. Adobe's A/B-testing guidance explains the risks of underpowered and poorly controlled experiments.
Assign users randomly and keep their assignment stable. Pick one primary metric tied to the business outcome, such as completed trial activation or paid conversion. Keep secondary metrics as guardrails: completion time, errors, retention, or refunds can reveal a variant that wins a click but damages the experience.
Protect the result from false confidence
Run the experiment until the planned sample is reached, through complete weekly cycles where practical. Don't stop when a dashboard first shows a favorable difference. Repeatedly checking results and ending a test at a convenient moment increases the risk of calling a random fluctuation a winner. Likewise, changing allocation mid-test or comparing many outcomes without a clear primary metric makes the result harder to trust.
An 80%-powered test still has a 20% probability of missing a real effect. An inconclusive result therefore doesn't prove that the change did nothing; it may mean the test couldn't distinguish the effect from noise. Treat the result as a decision about what evidence you have, not as a verdict about the idea in every context.
Revenue guardrail: A variant that increases button clicks but lowers qualified activation hasn't won. Follow users beyond the first click.
When a variant appears to win, confirm it in a separate cohort before rolling it out broadly. Check whether the pattern holds for detector-result completion, subsequent product use, and paid retention, rather than trusting the initial interaction alone. For teams aligning experiments with broader campaign work, Humantext.pro's article on marketing campaign optimization is a relevant companion.
The Surfaces Worth Optimizing First
A conversion problem often looks like a copy problem until the evidence points elsewhere. Visitors may misunderstand the offer, miss key information, abandon a form, or leave while a page loads. Choose the surface that matches the clearest friction in your audit, rather than defaulting to a familiar test.
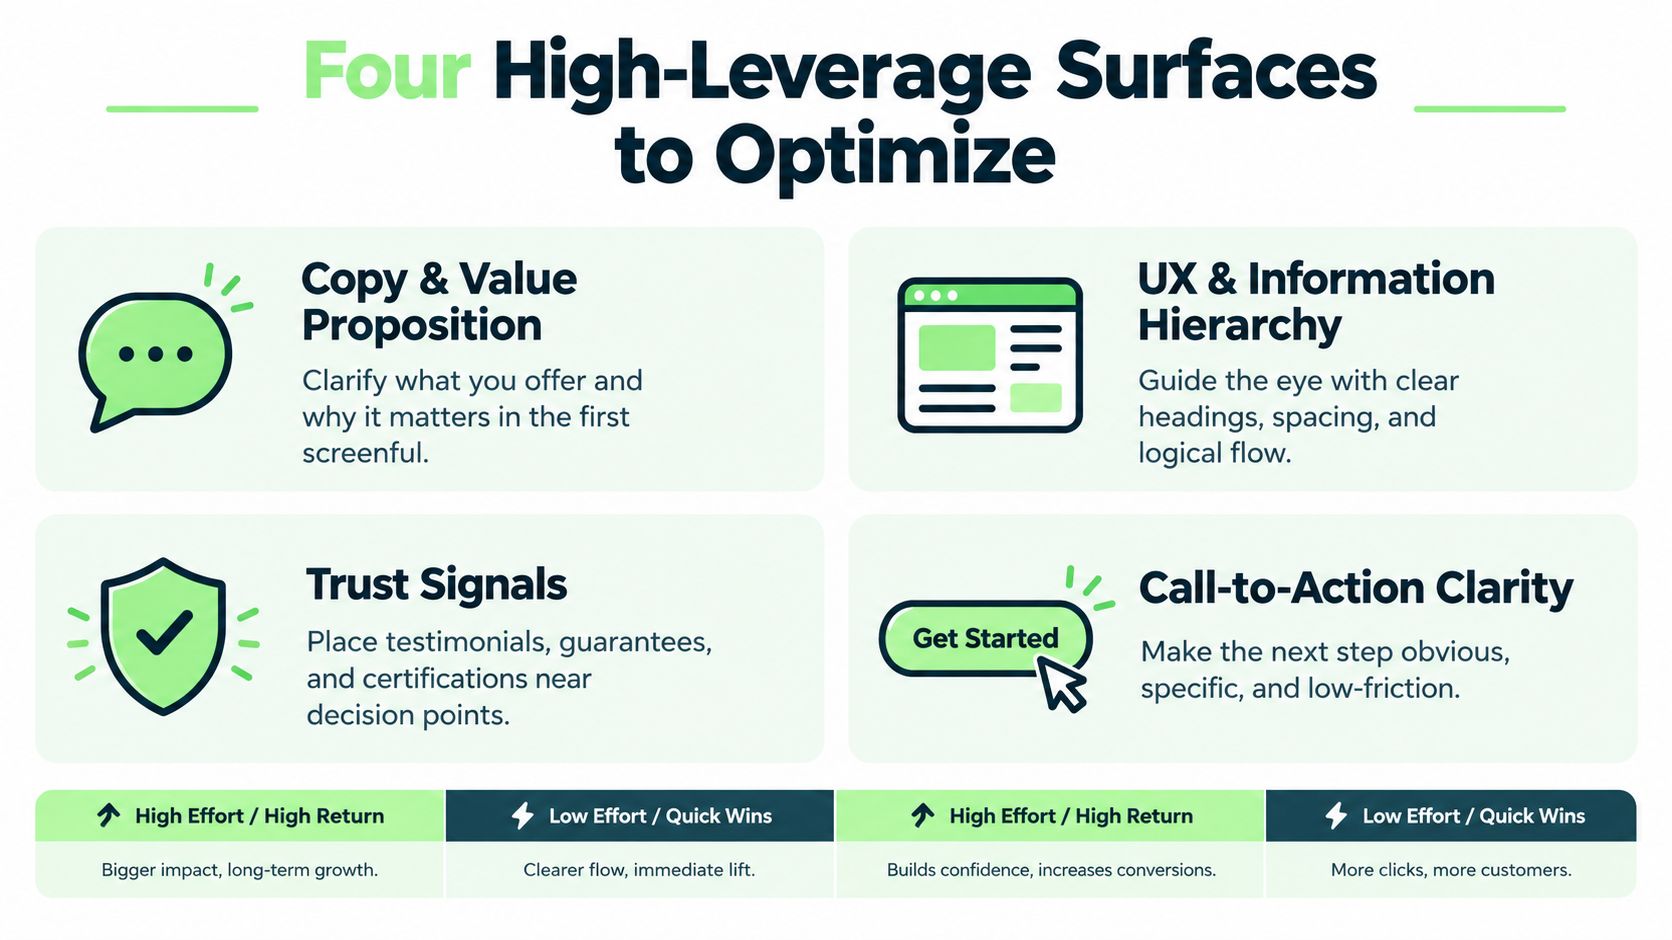
Copy and value proposition. If visitors can't explain what the product does or what happens after they act, test a clearer first-screen explanation against the current one. On a product page, compare benefit-led descriptions with feature-led ones. This guide to writing product descriptions covers how to make that information specific. Judge the change by qualified purchases and returns, not page engagement alone. Stronger wording won't rescue an offer people don't understand.
UX and information hierarchy. When visitors overlook key details or move back and forth between sections, test a more direct order of information. Put comparison details or trial terms where users need them, then track task completion and page exits. A cleaner layout can still hurt conversion if it hides information cautious buyers use to decide.
Checkout and forms. Baymard reports a 70.19% global average cart-abandonment rate and finds that the default U.S. checkout displays 23.48 form elements, compared with 12–14 in an ideal flow. Its research estimates checkout redesign could potentially produce a 35.26% conversion-rate increase for the average large ecommerce site. Treat these as benchmarks, not forecasts: implementation and audience affect results. Review every required field, remove inputs that aren't needed for the transaction, and test a shorter flow while tracking payment errors and completed orders. Baymard's checkout usability research explains the findings and their context.
Performance. If mobile visitors wait for a page or result, test faster rendering before rewriting the copy. Track task completion and errors by device. A quicker page is not a win if it fails to deliver the result.
Prioritize friction that affects a meaningful share of visitors. A button-color test may be quick to ship, but speed of implementation is not evidence of value. Fixing a broken or confusing checkout step can justify more engineering effort, especially when it blocks completed purchases. Measure downstream outcomes, too: a click lift matters only if it leads to qualified actions and revenue.
Testing Trust, Transparency, and AI-Assisted Traffic
Natural-sounding copy can help a visitor understand a page. It can't compensate for a message that feels misleading or a destination that doesn't support the recommendation that brought the visitor there. Test what converts believably, not just what attracts clicks.
Adobe reports that 74% of consumers consider disclosure of AI-generated content, recommendations, or images important, while 26% of brands currently meet that expectation. That gap makes transparency a credible test variable rather than a box to tick after the copy is written. A useful experiment can compare clearly labeled AI-assisted content with human-edited content that explains its use of AI, while tracking conversion alongside trust signals, refunds, and repeat intent. Don't assume disclosure will always raise or lower conversion; the audience and context matter. Adobe's retail AI and digital trends report provides the consumer and brand findings.
The timeline is concrete for European businesses. The European Commission says the EU AI Act's Article 50 transparency obligations apply from 2 August 2026. For AI systems placed on the market before that date, a limited grace period for the marking and detection obligation runs until 2 December 2026, and content generated before the start date doesn't need retroactive labeling. Rather than using vague compliance language, explain how your organization identifies AI-generated material, when it was created, and where a disclosure will appear. The Commission's Article 50 transparency FAQ sets out the timing.

AI-referred visitors deserve their own view in analytics. Adobe found that these visits had a 23% lower bounce rate than other traffic by February 2025, while their conversion disadvantage narrowed from 43% below non-AI traffic in July 2024 to 9% below by February 2025. Those results suggest that channel averages can conceal changing visitor intent. Adobe's analysis of generative-AI referral traffic provides the comparison.
For these visitors, test answer-to-page continuity: does the landing page substantiate the claim or summary that led someone to click? Segment AI referrals separately, then compare whether concise evidence, clear authorship, and human-edited explanations help visitors complete a meaningful action. Tools can support content production, but quality control remains the work. For teams building structured AI-assisted list content, Landra's listicle creator is one option to explore; any generated claims still need editorial verification.
A 90-Day Plan to Make the Gains Stick
A CRO program needs a working rhythm, not a stack of ideas waiting for a quiet week. Keep the record of what you observed, what you tested, and what the business learned.
Weeks one to four: establish the measurement. Confirm the primary conversion event, check that funnel events are recorded consistently, and segment the baseline by device, language, and traffic source. Run the first audits with analytics, replays, and short user tests. Produce a hypothesis log that records the evidence, audience, expected effect, metric, guardrails, and priority for each candidate.
Weeks five to eight: test the strongest opportunities. Start the highest-confidence experiments that your traffic can support. Ship low-risk clarity or usability fixes where evidence is strong, but don't fold untested changes into a live experiment without testing. Write a test-results memo that records the outcome, limitations, and decision, including when the result is inconclusive.
Weeks nine to twelve: validate and learn. Confirm promising results in a separate cohort before broad rollout. Review downstream behavior, not just the primary event, and decide whether to deploy, retest, or revert. Create a holdout confirmation note with the result and any audience differences, then use the retrospective to shape the next cycle. For a broader content workflow, Humantext.pro's content marketing best practices can complement the measurement process.
Conversion rate improvement compounds when teams stack honest tests and keep the evidence behind each decision. That discipline is a more durable advantage than shipping whichever opinion sounds most persuasive in a meeting.
Humantext.pro offers an AI detector with an instant AI-probability score and a humanizer that helps AI-assisted drafts read naturally while preserving meaning. If your CRO work depends on clear, verifiable content, visit Humantext.pro to try the free, no-signup 500-word trial.
Jste připraveni přeměnit svůj obsah generovaný AI na přirozený, lidsky znějící text? Humantext.pro okamžitě vylepší váš text a zajistí, že bude znít přirozeně a autenticky. Vyzkoušejte náš bezplatný AI humanizér ještě dnes →
Související články
Marketing Campaign Optimization: The Complete 2026 Guide
Learn marketing campaign optimization with proven frameworks, KPIs, and channel tactics. Includes A/B testing, incrementality, personalization
AI Writing Detector Free: 10 Tools Worth Testing
Compare 10 AI writing detector free options for accuracy, privacy, limits, and practical use by students, editors, and publishers.

What Is Natural Language and How Does It Shape AI
Learn what is natural language, how its layers of meaning work, why ambiguity matters, and how NLP and AI turn human communication into usable technology.

